
We draw heavily from the OpenShift 4 Consolidated Troubleshooting Article, its associated Quick Reference, the Machine Config Operator Troubleshooting Article, and a specific application troubleshooting article here and there. It's suggested to check the source articles listed for updates and addendums as future OpenShift releases may change the prescribed methodologies and commands.
This post is organized according to the structure that we use when presenting this material in a workshop setting. Adopting this structure, allows for focusing on troubleshooting OpenShift issues at three levels increasing in specificity: the cluster, the host, and the application.
Cluster Level
At the OpenShift cluster level, troubleshooting focuses on debugging cluster components and querying the API for status and events.
Determining Cluster Health and Status
You can query the OpenShift API for the health status of different cluster components and to collect diagnostic information. While this information is often requested by Red Hat when opening a support case, it is also useful for consolidated review by a partner.
Collect bulk cluster state information including resource definitions, audit logs, and service logs:
$ oc adm must-gather
Collect specifically the cluster’s version, cluster operators, and release information:
$ oc get clusterversion
$ oc get clusteroperators
$ oc adm release info $(oc get clusterversion -o \
jsonpath='{.items[].status.current.payload}{"\n"}')
Cluster Operators
In OpenShift, cluster level operators are responsible for the configuration and operation of key cluster services and components. Common issues usually require troubleshooting the following operators:
- Cluster Image Registry Operator
- Cluster Network Operator
- Cluster Storage Operator
- Machine Config Operator
You can perform the following commands to troubleshoot a cluster operator:
Check the operator’s status:
$ oc get clusteroperator <operator> -o yaml
Check the operator for errors:
$ oc describe clusteroperator <operator>
Collect pod logs from the operator’s namespace:
$ oc project <operator’s-namespace>
$ export PODS=`oc get pods -o=jsonpath="{.items[*].metadata.name}"`
$ for pod in $PODS;do oc logs $pod &> $pod.log;done;
Check the Deployment or the Installer:
$ oc get deployment/<operator>
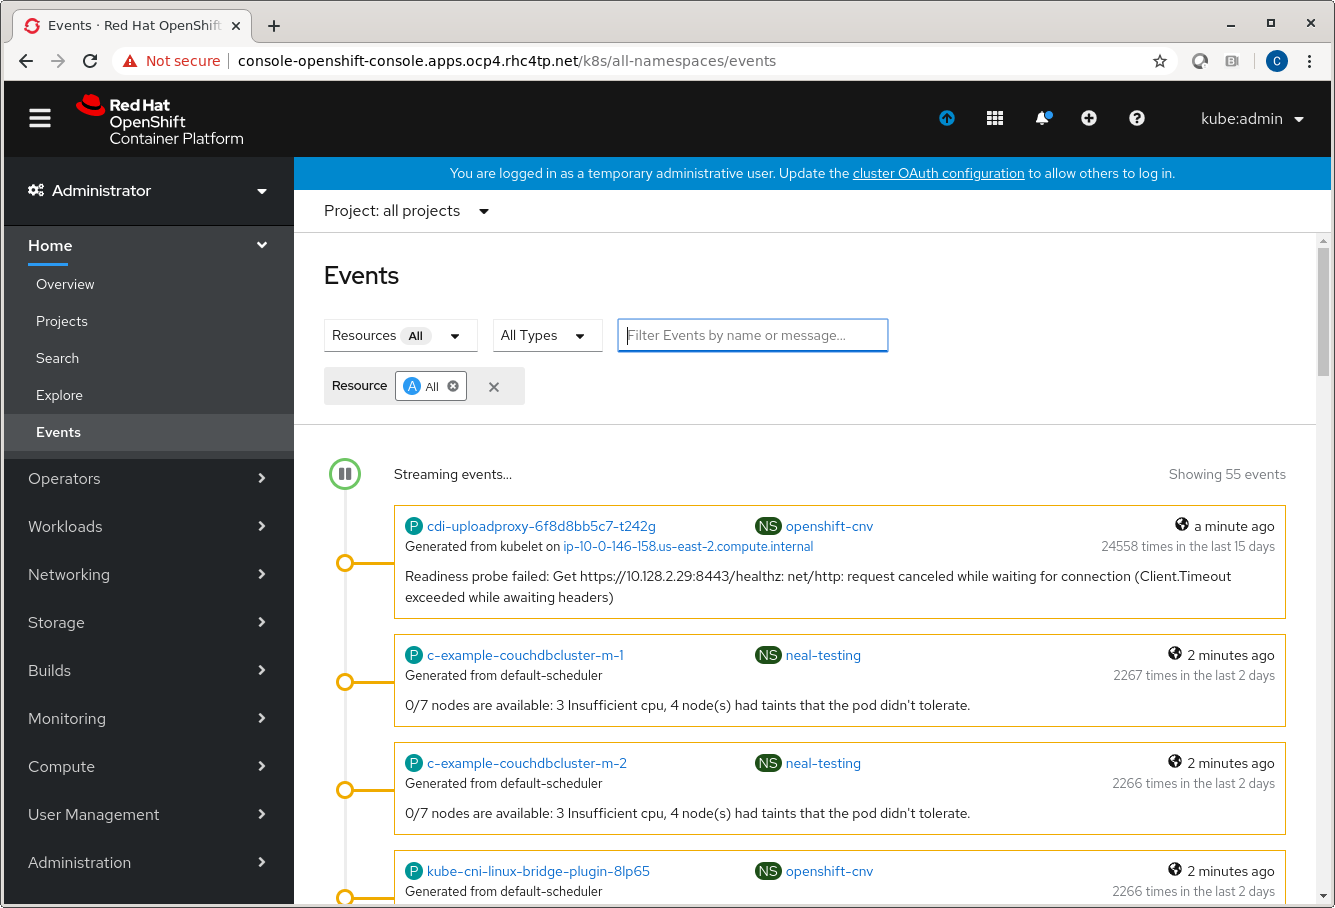
OpenShift Events
OpenShift Event resources contain system events collected per namespace. The default namespace contains cluster events. There are two methods for viewing events from the OpenShift API:
From the command line you can collect events with oc and filter them with tools like grep or jq:
See all events:
$ oc get events -n default
Use grep to search for Warning events:
$ oc get events -n default | grep Warning
Use jq to search for node registration events:
$ oc get events -n default -o json | jq '.items[] | select(.involvedObject.kind == "Node" and .reason == "RegisteredNode")'
From the Events tab in web console:
Host Level
At the OpenShift host level, troubleshooting focuses on debugging and log collection of the host Operating System and the Kublet.
Debug Node with oc CLI
Debugging a node with the oc tool is the preferred, safer method for opening a command shell on the node.
Usage:
$ oc debug node/<node-name>
Debug Node with SSH
In some situations, the above oc access method is just too restrictive. Troubleshooting tasks that require direct access to the node’s underlying Red Hat CoreOS, such as the ability to directly run Linux commands or perform disaster recovery procedures, can only be run through a privileged SSH connection.
You will need a separate bastion host or bastion pod to access the cluster. You also need the SSH key that was generated as part of the OpenShift cluster installation on hand to perform the authentication.
Usage:
$ ssh -i <ssh-key-path> core@<master-hostname>
For example, from this access method the following troubleshooting commands could be run:
$ sudo journalctl -b -f -u kubelet.service -u crio.service
$ sudo crictl pods
$ sudo crictl logs <pod>
$ sudo tail -f /var/log/containers/*
$ top -H
$ ps -ef
Retrieve Node Logs
You can retrieve system logs from Red Hat CoreOS to aid with troubleshooting by using the OpenShift oc adm command against the OpenShift API.
To view File Path logs, which are log files under /var/log:
$ oc adm node-logs --role=<master|worker> -u <systemd_unit>
$ oc adm node-logs --role=master --path=<path_under_/var/log>
$ oc adm node-logs --role=master --path=openshift-apiserver
To view Journald Unit logs:
$ oc adm node-logs --role=master -u kubelet
Retrieve Bootstrap Logs During Install
Issues that arise can sometimes be traced back to errors that occur during the installation of the node. Access to the bootstrap installation key pair is required.
Use the curl command to collect journal logs out of the kubelet:
$ curl --insecure --cert ${INSTALL_DIR}/tls/journal-gatewayd-client.crt \
--key ${INSTALL_DIR}/tls/journal-gatewayd-client.key \
'https://${BOOTSTRAP_IP}:19531/entries?follow&_SYSTEMD_UNIT=bootkube.service'
You can also collect information and logs at the time of installation:
$ sudo journalctl -b -f -u bootkube.service
$ sudo podman logs <pod>
$ sudo tail -f /var/lib/containers/storage/overlay-containers/*/userdata/ctr.log
Application Level
At the OpenShift application level, troubleshooting focuses on querying the OpenShift API for the health status of different application components and collecting different information. It may also be necessary to debug an application’s pod on and off of a cluster.
Debug with oc CLI and Web Console
First, open a remote shell session to the application’s container:
$ oc rsh <pod-name>
Collect resources applicable for troubleshooting:
$ oc api-resources --verbs=list --namespaced -o name
$ oc get deployments,daemonsets,pods,configmaps,services -n <namespace> -o yaml
$ oc describe <object> -n <namespace>
Collect pod logs:
$ oc logs <pod> -n <namespace>
Alternatively, view logs in web console:
Component Endpoint Debugging
You can also collect information directly from an application’s different endpoints using the OpenShift API.
Open a port to the component you want to debug:
$ oc -n openshift-apiserver port-forward apiserver-9zm2n :8443
List all endpoints:
$ oc get --insecure-skip-tls-verify --server=https://localhost:<port> --raw=/
Get component versions:
$ oc get --insecure-skip-tls-verify --server=https://localhost:<port> --raw=/version`
Get endpoint health/status:
$ oc get --insecure-skip-tls-verify --server=https://localhost:<port> --raw=/healthz`
Get metrics from endpoints:
$ oc get --insecure-skip-tls-verify --server=https://localhost:<port> --raw=/metrics`
Debug Crashing Pods
To troubleshoot crashing pods, these usually exhibit a CrashLoopBackOff status, there are several areas to investigate:
Check the Dockerfile verifying the ENTRYPOINT
Verify the Command and Args attributes of the container:
$ oc describe pod <pod-name>
Ensure the image runs locally outside of OpenShift using podman
Check previous pod’s logs:
$ oc logs <pod> -p
Create a copy of the pod with a shell for debugging:
$ oc debug <pod>
Conclusion
In this post we presented what we have found to be the most helpful OpenShift troubleshooting resources that we share with partners who are adopting OpenShift. Be sure to check the source articles listed throughout the post and the references listed below for updates as new versions of OpenShift are released. If you are a partner or even a customer, hopefully you will find this post helpful for assisting with OpenShift troubleshooting. Are you interested in becoming a Red Hat partner and adopting the OpenShift platform for your application? If you have questions, please submit them to our virtual Partner Success Desk.
References & Learning More
Consolidated Troubleshooting Article OpenShift Container Platform 4.x
OpenShift 4.x Troubleshooting Quick Reference
Troubleshooting OpenShift Container Platform 4: Machine Config Operator
Exploring Application Endpoints for the purposes of Debugging with OpenShift 4.x
Troubleshooting OpenShift Container Platform 4.x: Image Registry Operator
CrashLoopBackOff status for Openshift Pod
How to connect to OpenShift Container Platform 4.x Cluster nodes using ssh bastion pod?
How do I debug an application that fails to start up? · OpenShift Cookbook
SRE Life: Helpful Pointers for Debugging OpenShift